The Nuclear Rotor Atlas Explorer

by Stephen Euin Cobb

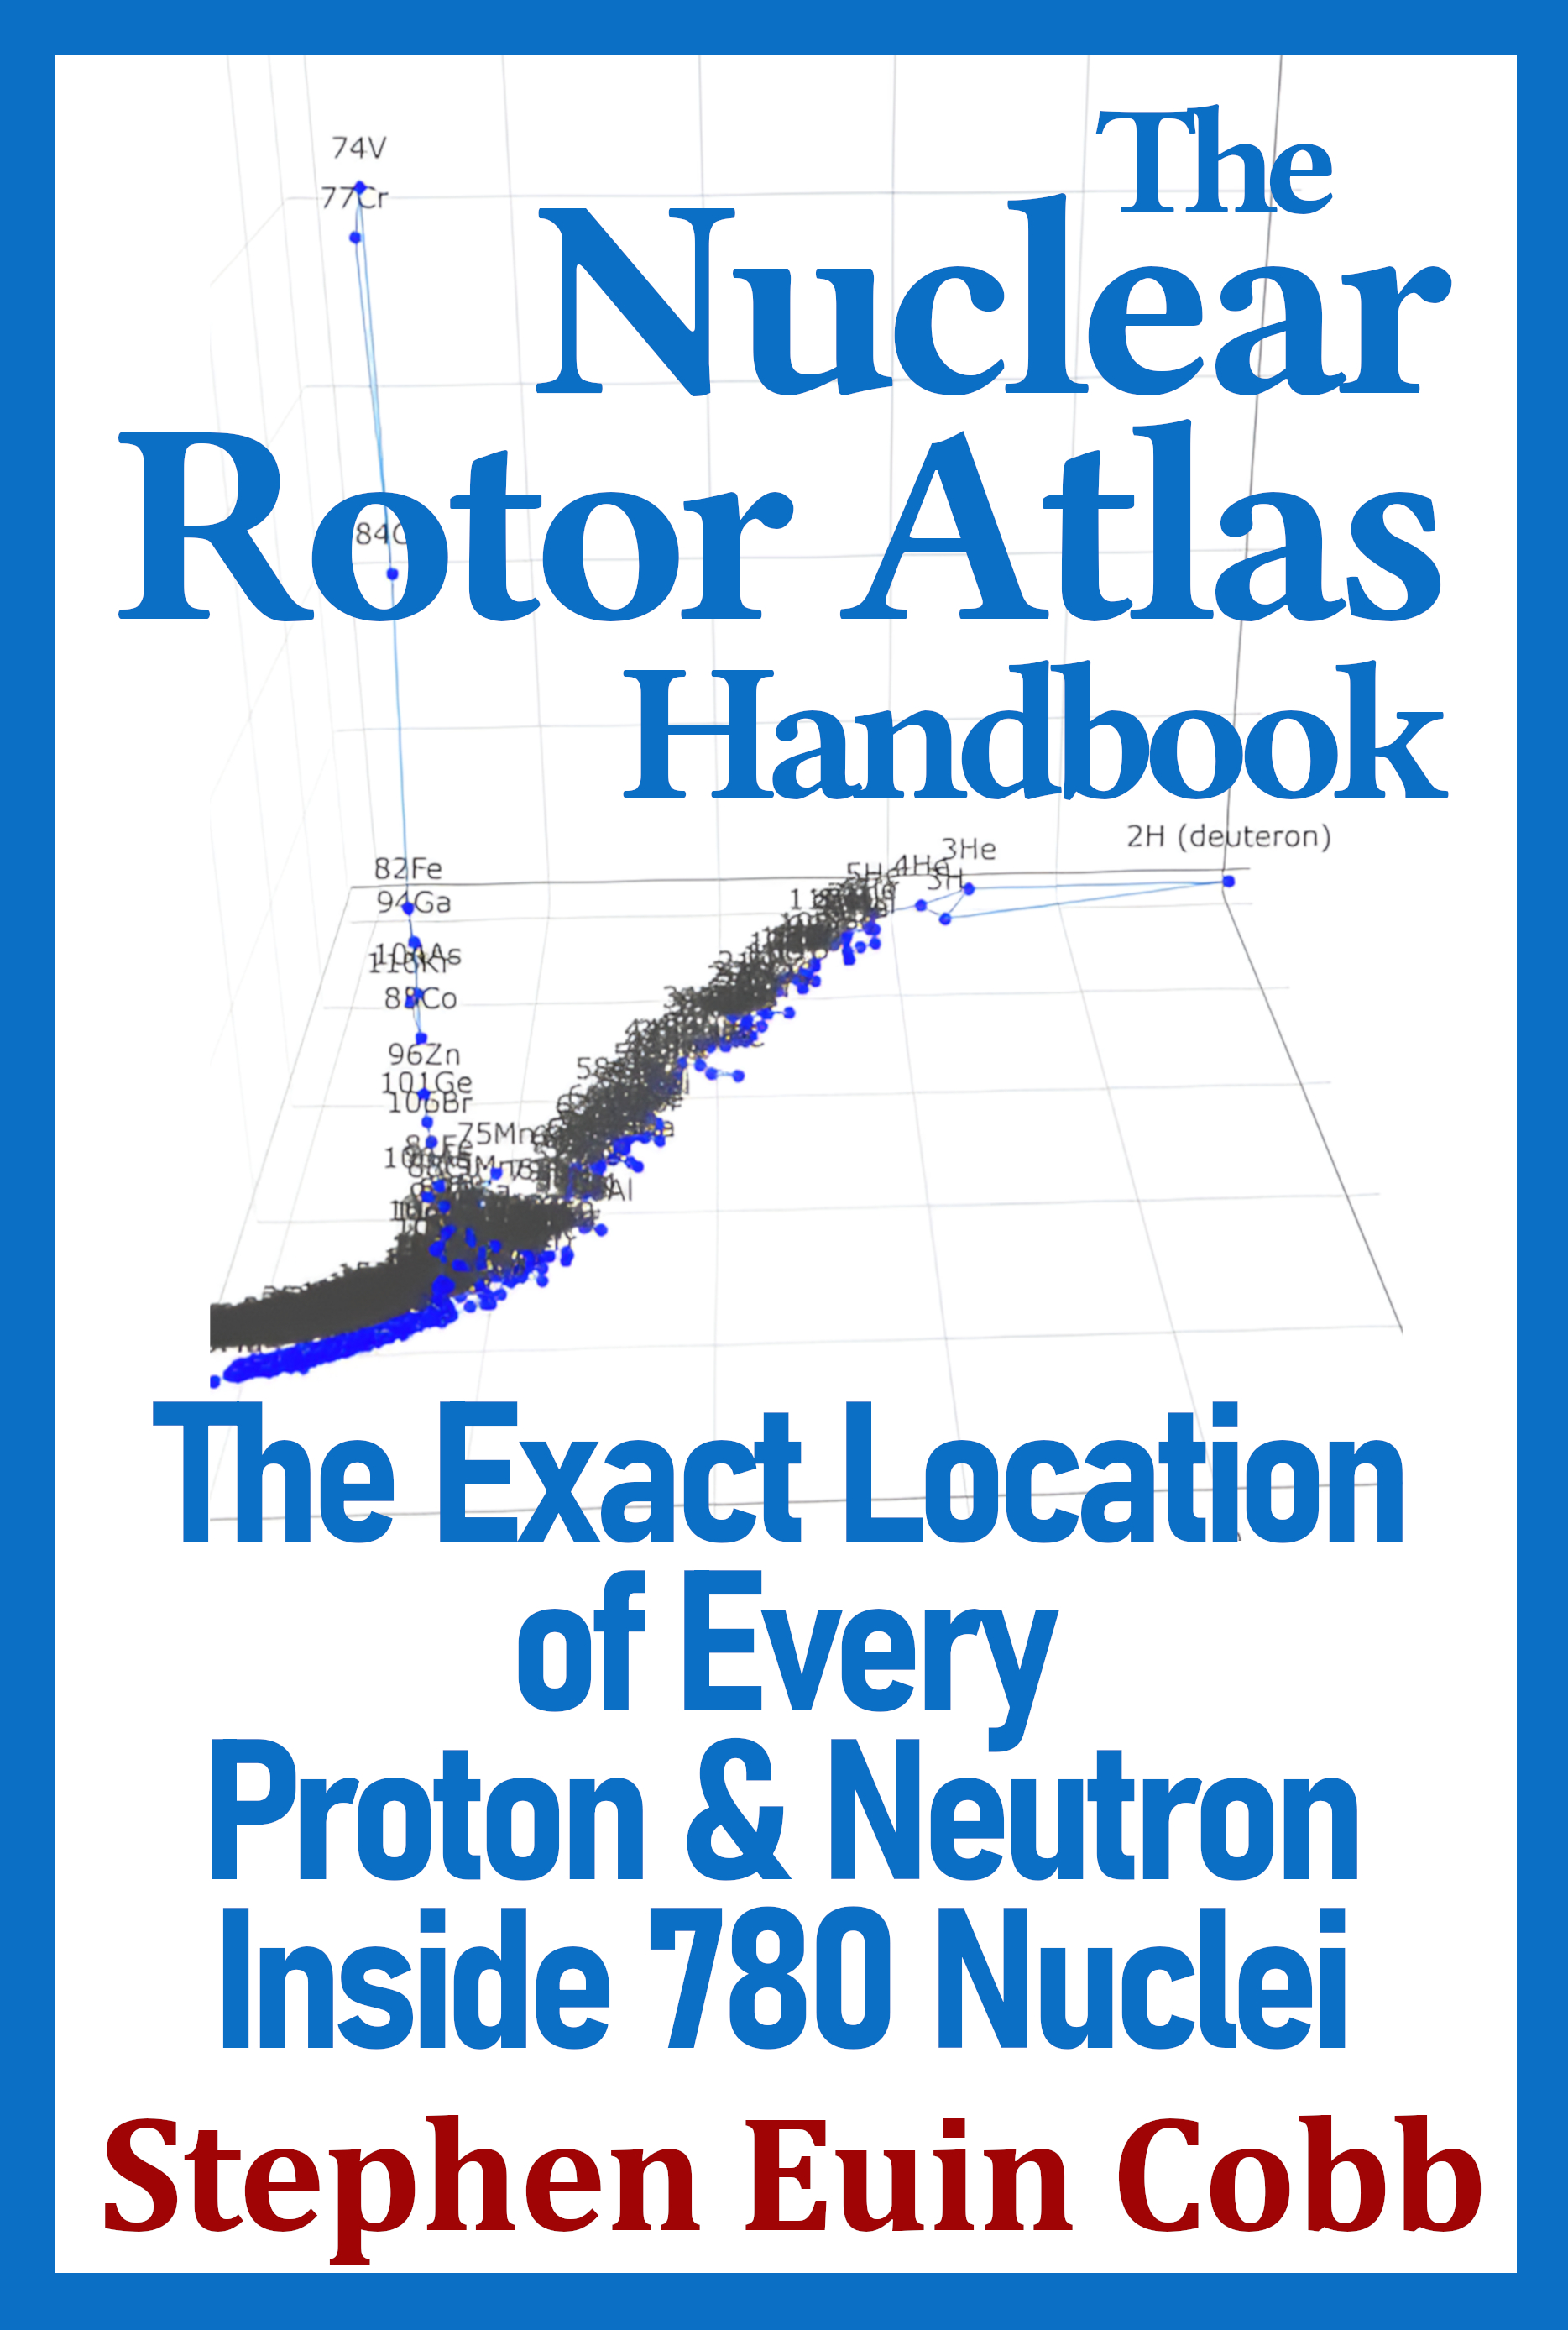
A 3D, interactive view of 780 nuclei along the valley of stability. Each point is an isotope; you choose which derived metrics appear on the X, Y, and Z axes.

Interactive 3D chart (demo)
What you see above is a rotating three-dimensional chart of 780 nuclei selected from along the valley of stability. Each dot in the chart is an isotope, and the values for each of the three axes are adjustable by the user. The video displays some of the features you can experiment with.

Use the 3-D chart

To use the 3-D chart, click here or on the video above. (It takes about 10 seconds to load.)

The dataset used to create this 3-D chart was calculated by Stephen Euin Cobb for his Nuclear Rotor Atlas. The Nuclear Rotor Atlas dataset is open-source and is available for download. You are free to use it, model from it, quote it in your papers, and improve it. Most especially, to improve it.

Documentation & parameters

Detailed background on the parameters used in the 3-D chart, including units and how they were calculated:
Research papers

Datasets

More from the author